Series: Bioremediation | Difficulty: Beginner | Estimated Time: 30 Minutes (Active) + 21 Days (Observation/Data Collection)
Introduction
In municipal water systems, "greywater" is the runoff from our sinks, showers, and washing machines. It is not raw sewage, but it is heavily contaminated with nitrates and phosphates from soaps, detergents, and human shed. When this water enters local rivers and lakes untreated, it causes massive algal blooms—a process called eutrophication—that suffocates aquatic life by stripping oxygen from the water.
In this module, we are engineering a biological filtration system on a windowsill. We will synthesize a batch of concentrated greywater and deploy specific "hyperaccumulator" plants to execute a process called rhizofiltration.
These plants do not just survive in contaminated water; they actively seek out, absorb, and sequester heavy chemical loads to fuel their own rapid cellular growth. By tracking the chemistry of the water over three weeks, you will quantify the exact filtration capacity of a living root network.
The Biology & Chemistry - Rhizofiltration Mechanics
How does a plant clean water? It is an active, energy-intensive cellular process.
When hyperaccumulators—such as Lemna minor (duckweed) or Chlorophytum comosum (spider plants)—suspend their roots in contaminated water, they engage two primary mechanisms:
Root Exudates: The roots excrete specific organic acids and enzymes into the surrounding water. These chemicals break down complex, synthetic organic molecules (like the surfactants found in laundry detergent) into smaller, bioavailable fragments.
Active Membrane Transport: To pull nutrients out of the water and into the plant, the cells must often work against an osmotic gradient. Specialized transport proteins in the root cell membranes use ATP (cellular energy) to grab negatively charged ions—specifically Nitrates ($NO_3^-$) and Phosphates ($PO_4^{3-}$)—and pull them inside.
Once inside, the plant uses the nitrogen to build amino acids and the phosphorus to synthesize ATP and DNA. The pollutant is entirely transmuted into green biomass.
Safety Framework: R.A.M.P.
Recognize hazards: We are handling concentrated synthetic fertilizers to simulate greywater, and utilizing aquarium chemical test strips.
Assess risks: Mild skin or eye irritation from direct contact with the fertilizer concentrate. Accidental ingestion of the testing strip reagents.
Minimize risks: Wash hands thoroughly after setting up the experiment and after handling the test strips. Do not use containers that will be used for food or drinking water later.
Prepare for emergencies: If concentrated fertilizer splashes into the eyes, flush immediately with cool water for 15 minutes.
Materials & Equipment
The Biological Inputs:
Hyperaccumulators: 2 healthy Spider Plant "pups" (with small root nodes starting to form) OR a handful of live Duckweed (available at any aquarium supply store).
The Chemicals:
The Contaminant: Standard high-phosphate liquid houseplant fertilizer OR $1\text{ teaspoon}$ of powdered laundry detergent.
Distilled Water: $3\text{ Liters}$. (Do not use tap water, as existing chlorine and municipal mineral loads will skew the data).
The Hardware:
3 identical $1\text{-Quart}$ ($32\text{ oz}$) clear glass Mason jars.
Aquarium Water Test Strips (Must specifically measure Nitrate and Phosphate levels).
A notebook or spreadsheet for data logging.
The Procedure: Engineering the Bio-Filter
Phase 1: Synthesizing the Greywater
To accurately measure bioremediation, we must standardize our contaminant load.
The Mix: In a large pitcher, mix $2\text{ Liters}$ of distilled water with a heavy dose of your contaminant ($5\text{ mL}$ of liquid fertilizer or $1\text{ teaspoon}$ of dissolved laundry detergent).
Baseline Testing: Dip one of your aquarium test strips into the pitcher. Record the exact starting concentrations of Nitrates and Phosphates. This reading represents "Day 0" of your synthetic greywater. It should register exceptionally high.
Phase 2: Establishing the Test Matrix
We are setting up a controlled experiment to prove the plants are doing the work, not just natural chemical degradation.
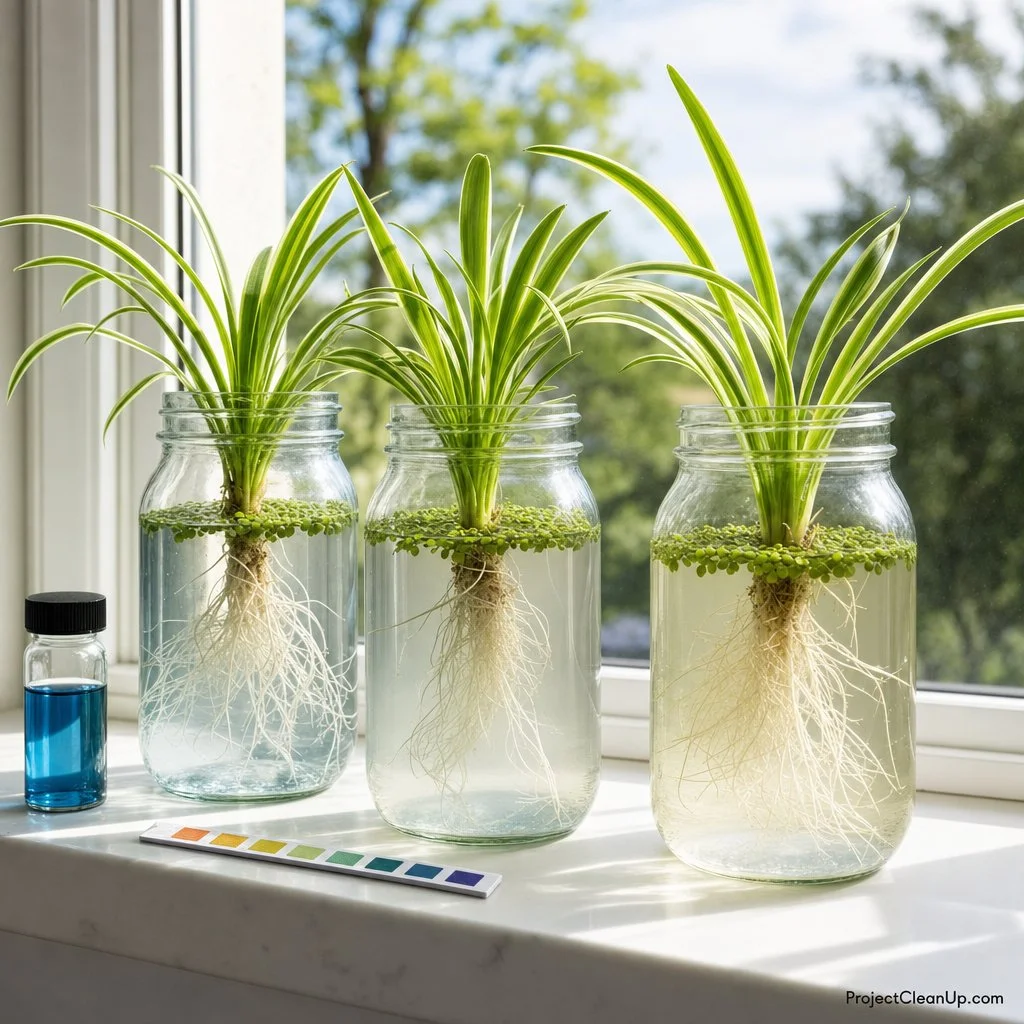
Jar 1 (The Active Reactor): Fill with the synthetic greywater and place your Spider Plant pup so its roots are submerged (or float your duckweed on top).
Jar 2 (The Control): Fill with the synthetic greywater, but add NO plants. This will prove that any drop in chemical levels in Jar 1 is due to the biology, not evaporation or settling.
Jar 3 (The Baseline): Fill with pure distilled water and place your second Spider Plant pup inside. This acts as a health baseline for the plant.
Phase 3: The Incubation & Data Collection
Place all three jars on a sunny windowsill. The plants require high light exposure to drive the photosynthesis needed to power the active transport of the pollutants.
The Weekly Protocol: Every 7 days (for exactly 3 weeks), use a fresh test strip to check the water in Jar 1 and Jar 2.
Log the Data: Record the $NO_3^-$ and $PO_4^{3-}$ levels. Also, note the physical growth of the roots. In Jar 1, you will likely see an explosion of dense, white root hairs as the plant aggressively hunts the dense nutrient load.
Topping Off: Because plants transpire water, the liquid level in Jar 1 will drop faster than Jar 2. If the roots become exposed, top off Jar 1 with pure distilled water only (do not add more greywater).
Phase 4: Analysis
By Day 21, test the water one final time. In a successful rhizofiltration loop, Jar 2 (Control) will still read as highly toxic, while Jar 1 will show a massive reduction in nitrate and phosphate load. The water has been chemically scrubbed, and the chemical potential energy has been converted into the physical structure of the newly grown roots and leaves.
The Digital Twin: AI Simulation Prompt
Want to visualize the speed of your filtration system? Copy and paste the prompt below into your AI assistant to generate a Python data visualization modeling the decay curve of the pollutants in your jars.
Prompt to copy/paste:
"I just conducted a phytoremediation experiment using hyperaccumulator plants to strip nitrates from synthetic greywater over a 21-day period. Please write a Python script using the matplotlib library to generate a line graph showing this process.
The X-axis should be 'Time (Days)' from 0 to 21.
The Y-axis should be 'Nitrate Concentration (ppm)', starting at 100 ppm.
Plot two lines: 'Control Jar (No Plant)' which remains relatively flat at 100 ppm, and 'Active Reactor (Hyperaccumulator)' which models a first-order decay curve dropping from 100 ppm down to near zero by day 21.
Ensure the graph is highly legible, includes a legend, and uses a clean, modern aesthetic."